NFL Week 1 Generates $424 Million in Kalshi Prediction Market Volume

The Aldrin data for September 8 through 14 reveals a singular, defining figure that sets the context for the entire week’s market performance.
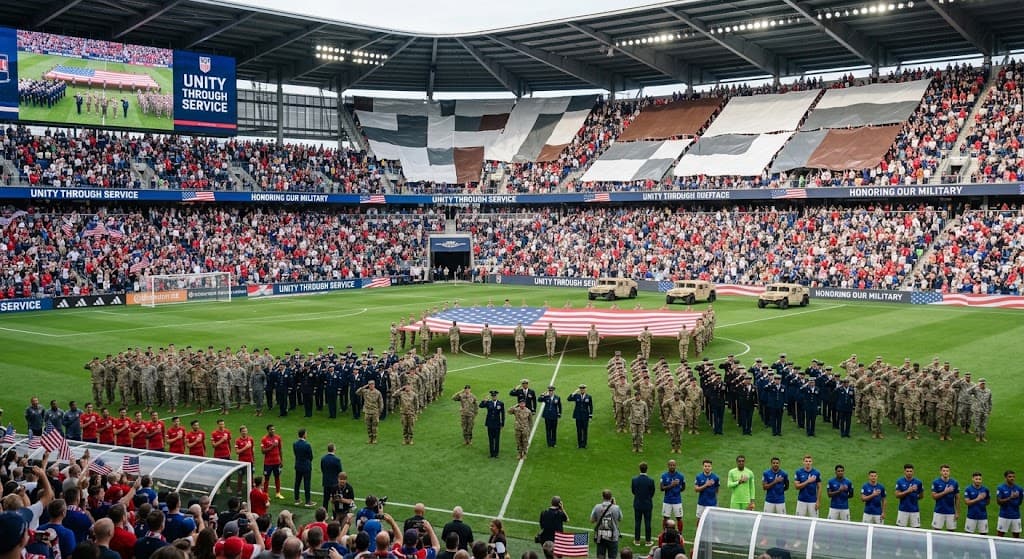
Four NFL games from Week 1 appear in Kalshi's top ten non-World Cup individual events since June 11. Combined, those four games generated $424 million in trading volume on a single exchange in a single week of a sports calendar that runs for 18 more weeks before the Super Bowl.
Dallas versus Giants: $112 million. Denver versus Kansas City: $111 million. New England versus Seattle: $105 million. San Francisco versus the LA Rams: $96 million.
Those four numbers are the answer to the question the prediction markets industry has been asking since Kalshi won its CFTC battle and sports contracts became legal. The NFL is not a category the market is waiting to unlock. It is a category the market unlocked in its first full week of legal operation and immediately produced nine figures of volume per game.
The Week's Top-Line Numbers
Total combined volume across CFTC-regulated exchanges for September 8 through 14 was led by Kalshi at $13.4 billion, up 13.3% from the previous week's $11.8 billion. Kalshi held 79.5% of total market volume, down from 84.9% the week before. That 5.4 percentage point decline in share is the largest single-week redistribution recorded since the scoreboard began tracking.
Polymarket US generated $1.7 billion, up 64.6% from $1.1 billion. The 64.6% recovery is direct arithmetic on the prior week's outage cost. The platform that grew 6.5% on the highest-volume Saturday of the college football season grew 64.6% the following week when the NFL arrived and the platform stayed online. The gap between those two growth rates is the dollar value of working infrastructure during peak demand.
DKeX processed $464 million, up 105.2% from $226 million. That is the second consecutive week of triple-digit percentage growth for DraftKings' designated contract market. Week one of college football produced a 609.9% gain to $226 million. Week one of the NFL produced a 105.2% gain to $464 million. Two weeks of legal sports prediction markets and DraftKings has gone from a minor volume contributor to the third-ranked CFTC-regulated exchange.
Rothera processed $343 million, up 92.1% from $178 million. Underdog Exchange processed $183 million, up 101.6% from $91 million. Every exchange in the top ten grew except Gemini, which declined 11.2% to $9 million.
What DKeX's Second Consecutive Triple-Digit Week Means
The 609.9% gain in week one of college football was easy to read as an opening-weekend spike. A platform introduces a new product category to its existing user base, the novelty drives a burst of activity, and the growth rate normalizes in subsequent weeks.
The 105.2% gain in week one of the NFL rules out that interpretation.
DKeX grew more than 100% in a week that was not its first week. It grew 100% on top of a base that was already 609.9% larger than where it started. The cumulative effect is that DraftKings' prediction market exchange now processes volume that is roughly 14 times larger than it was three weeks ago. At $464 million for the week, DKeX is not a rounding error in the market's volume table. It is the third-largest regulated prediction market exchange in the United States.
The product composition provides the structural explanation. DKeX's combo volume for the week was $279 million, representing 60.1% of its total volume. On the combo leaderboard, DKeX grew 166.7% in the combo category, the largest percentage gain of any exchange. DraftKings built the dominant US fantasy sports and sports betting platform on the back of parlay products. Its users already know how to build multi-leg combinations. When those users encounter prediction market combo contracts, they are using a familiar interface on a product they already understand. The adoption curve is not starting from zero. It is starting from a decade of user education DraftKings already completed.
The Combo Table and What It Shows About Platform Identity
The combo leaderboard for September 8 through 14 reveals the strategic identity of each exchange more clearly than the overall volume table.
Kalshi generated $7.7 billion in combo volume, representing 86.0% of the total combo market and 57.5% of its own overall volume. Kalshi is, by volume composition, primarily a combo exchange. More than half of all money traded on Kalshi in any given week is traded in multi-leg combination contracts. The platform that won the regulatory battle to make sports event contracts legal did so on the back of a product architecture that is fundamentally parlay-shaped.
Polymarket US generated $597 million in combo volume, up 100.9%. The doubling of Polymarket's combo volume in a single week is the clearest indication that the prior week's underperformance was infrastructure-related rather than demand-related. The underlying demand for combo contracts on Polymarket was there. The platform's ability to process that demand during peak load was not. When the load stabilized, the volume appeared.
DKeX at $279 million and 166.7% combo growth, Underdog Exchange at $138 million and 106.7% combo growth, Novig at $122 million and 40.0% growth: every exchange except ProphetX saw its combo volume grow faster than its overall volume. The combo category is outpacing the broader market because the NFL user is primarily a parlay user, and the NFL is now the dominant volume driver.
The Individual Event Data That Reframes the Entire Market
The Kalshi top individual events chart covering June 11 through September 14 is the single most instructive document in this week's data release. It provides event-level granularity that the weekly aggregate numbers obscure.
The Mexico versus England match on July 5 generated $401 million in trading volume on Kalshi alone. That is the largest single event in the dataset. The France versus England bronze medal match on July 18 generated $332 million. France versus Spain on July 14 generated $326 million. England versus Argentina on July 15 generated $316 million.
Four consecutive World Cup knockout-round matches each generated between $316 million and $401 million. The average across the top ten World Cup events is $289 million per game.
Now place the NFL numbers next to those figures.
Dallas versus Giants: $112 million. The top NFL game from Week 1 generated 27.9% of what Mexico versus England generated. The top NFL game generated 35.5% of what the average top-ten World Cup game generated.
This is the number the NFL advocates inside the prediction markets industry need to sit with. The NFL is the highest-viewership domestic sporting event in the United States. It produced four games above $96 million in a single week. And each of those four games produced less than a third of what a single World Cup knockout match generated on the same exchange.
The explanation is not that the NFL is a smaller sport in prediction market terms. The explanation is that the World Cup ran with the rest of the world's prediction market liquidity, including Polymarket's global user base, while the NFL is operating exclusively within the US regulatory framework during the early weeks of the market's legal existence. The World Cup numbers reflect what a global event generates when international liquidity is pooled. The NFL numbers reflect what a US domestic event generates when the legal infrastructure is three weeks old.
Both facts are true simultaneously. The World Cup is currently a larger per-game prediction market event than the NFL. The NFL is growing at 105.2% per week and has 17 more weeks of regular season before playoffs begin.
The Non-World Cup Hierarchy and Its Implications
Below the NFL in the non-World Cup top ten, two entries are worth examining individually.
The Knicks versus Spurs NBA Finals Game 5 on June 13 generated $200 million, the largest non-World Cup, non-NFL event in the dataset. That game was played before the World Cup began and sits at the top of the non-World Cup list above every NFL game from Week 1. An NBA Finals game in the closing stretch of a championship series generated more Kalshi volume than any individual NFL regular-season opener.
The McGregor versus Holloway 2 rematch on July 11 generated $120 million. A single UFC fight produced more volume than four of the five NFL games in the top ten non-World Cup events. Combat sports generate prediction market volume at a per-event rate that the NFL regular season cannot yet match on a game-by-game basis.
The implications for exchange strategy are direct. Kalshi's exotics category, which generated $6.1 billion in the prior week at 51.7% of total volume, exists because the prediction market audience is not a sports-only audience. The users who trade NBA Finals markets are not necessarily the same users who trade NFL markets. The users who trade UFC markets may overlap with neither. An exchange that can capture all three simultaneously holds a structural advantage over an exchange that optimizes for one.
The Rothera Story
Rothera processed $343 million for the week, up 92.1% from $178 million. In two consecutive weeks, the exchange has grown 19.9% and then 92.1%. Its volume has nearly doubled in a fortnight.
The prior week's data showed Rothera at 96.6% sports volume concentration. No other exchange in the top ten runs a sports concentration that high. Rothera is a pure sports prediction market, and the arrival of the NFL has been the most consequential event for its volume of anything in the past year.
At $343 million for the week, Rothera is within $7 million of the fourth-ranked exchange, Crypto.com at $350 million. If its growth rate continues at even half the pace of the last two weeks, Rothera will pass Crypto.com within days and approach DKeX within the next two to three weeks. A platform that held under 2% market share a fortnight ago is now positioned to break 2.5% within the current week.
The sports-only concentration that looked like a limitation when exotics dominated Kalshi's volume table looks like a design decision when the NFL season begins and produces 92.1% weekly volume growth.
The Polymarket Recovery and What It Confirms
Polymarket US at $1.7 billion, up 64.6%, is the clearest data point in the week's results once the prior week's outage is accounted for.
The prior week produced $1.1 billion with a documented outage during the college football Saturday that cost the platform market share on the highest-volume day of that window. The current week produced $1.7 billion with, by all available accounts, stable platform performance through NFL Week 1. The $600 million increase from week to week is the partial recovery of volume that should have flowed to Polymarket the previous Saturday and did not because the exchange was unavailable.
Polymarket's combo volume at $597 million and 100.9% growth deserves separate attention. The prior week's outage occurred during peak sports trading hours. Combo contracts, which require multiple simultaneous market operations to construct, are the most infrastructure-intensive product type on any prediction exchange. A platform that cannot stay online during peak sports load will lose combo volume before it loses straight contract volume, because combo users are the highest-intensity users. The 100.9% combo recovery confirms that the user demand was present in the prior week even when the infrastructure was not.
The Gemini Anomaly
Every exchange in the top ten grew from the prior week except Gemini, which declined 11.2% to $9 million.
Gemini at less than 0.1% market share with declining volume in a week when the NFL produced record per-game prediction market volume is a data point about product-market fit rather than market conditions. The week was good for every other exchange in the top ten. The week was bad for Gemini specifically.
Gemini's prediction market product is attached to a crypto-primary exchange with a user base oriented toward digital asset trading rather than sports event contracts. The week that drove DKeX up 105.2%, Rothera up 92.1%, and Underdog Exchange up 101.6% was a sports-driven week. Gemini's user base is not a sports-primary user base. The NFL catalyst that lifted the rest of the market did not reach Gemini's product.
At $9 million and declining, Gemini is approaching the threshold where its prediction market operation becomes difficult to justify as a competitive product. CME Group at $19 million and up 17.3% is not a sports-focused exchange either, but it is growing rather than contracting. The direction of the two lowest-volume exchanges in the top ten is diverging.
The Number That the Week's Data Produces
Add the four top NFL games from Week 1 on Kalshi: $112 million, $111 million, $105 million, $96 million. Total: $424 million from four games in one week on one exchange.
The NFL regular season runs 18 weeks. Each week has roughly 13 to 16 games. Not all of them will produce top-ten volume. But the four games that did produce top-ten volume this week generated more combined trading activity than the McGregor versus Holloway 2 fight, the Shelton versus Alcaraz US Open match, and the Navone versus Djokovic match combined, with $124 million left over.
The prediction markets industry processed $13.9 billion in total volume in the week of September 1 through 7, before the NFL started. The week of September 8 through 14 has not been fully reported in aggregate yet, but the directional evidence from DKeX at $464 million, Polymarket at $1.7 billion, Rothera at $343 million, and Kalshi at $13.4 billion points to a total that is meaningfully larger than the prior week's figure.
The NFL has 17 regular season weeks remaining. The NBA season begins in October. The college football schedule runs through December. The CFTC rulemaking that tribal nations have promised to challenge in court is still pending finalization.
The market that produced $49.5 billion in the 30 days ending September 7 is operating under a sports calendar that was one week old when that figure was recorded. Every number in this week's data is the baseline from which a full NFL regular season begins.
Rate this piece — one tap, no signup
Political Markets Correspondent
Mary Ngaruiya is our Political Markets Correspondent, covering the intersection of legislative policy, financial markets, and regulatory conflict. Her reporting focuses on the evolving federal preemption debate, including disputes between the CFTC and state gaming regulators, while breaking down the legal and regulatory issues shaping event-based markets.
Mary also tracks emerging legal risks around prediction markets, including questions about whether federal employees can trade sensitive event contracts and why regulatory rulings can differ across states such as Nevada and Massachusetts. Her work aims to make complex policy and legal developments easier for readers to understand, particularly as the lines between traditional gaming, financial markets, and event contracts continue to shift.
Alongside her political markets coverage, Mary is a specialist in iGaming and contributes to BettingTop10, where she writes casino reviews, sportsbook reviews, betting guides, and other practical content for online betting audiences. This experience gives her a broader understanding of the gambling industry, from regulatory policy and market structure to the platforms and products used by everyday bettors.
The Weekly Signal
Every Friday — the week's sharpest prediction market analysis, forecasting insights, and data-driven commentary. No noise.
Disclaimer: This content is for informational and educational purposes only. It does not constitute financial advice, investment recommendations, or trading guidance. Prediction market participation involves risk of loss. Always conduct your own research before making any financial decisions.